SKU Analysis Dashboard for a Healthcare & Life Sciences Client

- The client, a prominent healthcare and life sciences company based in the US, required an in-depth analysis of their product sales data across different SKUs and countries
- The goal is to leverage this data to gain actionable insights into sales performance, product popularity, and regional distribution
- Develop a Power BI dashboard to analyze various aspects such as sales performance, product popularity, and country-wise distribution of healthcare products
- Compiled a dataset with attributes such as product id, product name, SKU, country, category, subcategory, price, units sold, sales revenue, and date. Ensured data accuracy and consistency across all entries
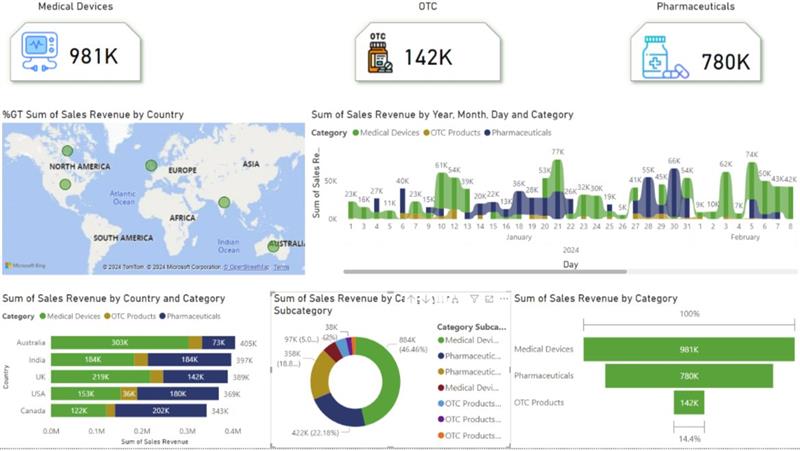
- Created a user-friendly Power BI dashboard to visualize key metrics and trends. Included interactive features to allow dynamic filtering and drilling down into specific SKUs or countries
- Visualized sales revenue and units sold over time to identify trends and peak periods
- Analyzed which products were most popular in each country and category
- Assessed how different products performed across the five countries to identify regional strengths and weaknesses
- The dashboard identified underperforming SKUs and regions, enabling targeted marketing and strategic adjustments
- It also provided a clear overview of product performance and market trends, aiding in strategic planning and enhancing overall decision-making